The data sets come from WRDS. The annual data for earnings, cash flows, and leverage ratios of corresponding fiscal years are collected. Measurement error due to sample selection, and processing of missing data for stocks with short history may affect the conclusion.
Introduction & Discussion
Data Set
The WRDS Compustat data for all stocks contains the fundamental informations including, cusip code for each ticker, fiscal year, total asset, average short term debt, long term debt, EBIT, EBITDA and cash flows. Then, the leverage ratio is created by the ratio of total debt over total asset. The data is collected from 1973 through 2015.
Data Processing
We notice that due to financial report format, some cash flows items may be missing as the company report working capital instead. Since it is hard to collect precise short-term debt numbers, some of the short-term debt data are missing. The fiscal years with missing values of leverage ratio and cash flows are retained.
Methodology
R Package “data.table” is used to process the data. The data visualization is accomplished through ggplot2 and htmlTable.
Performance Analysis
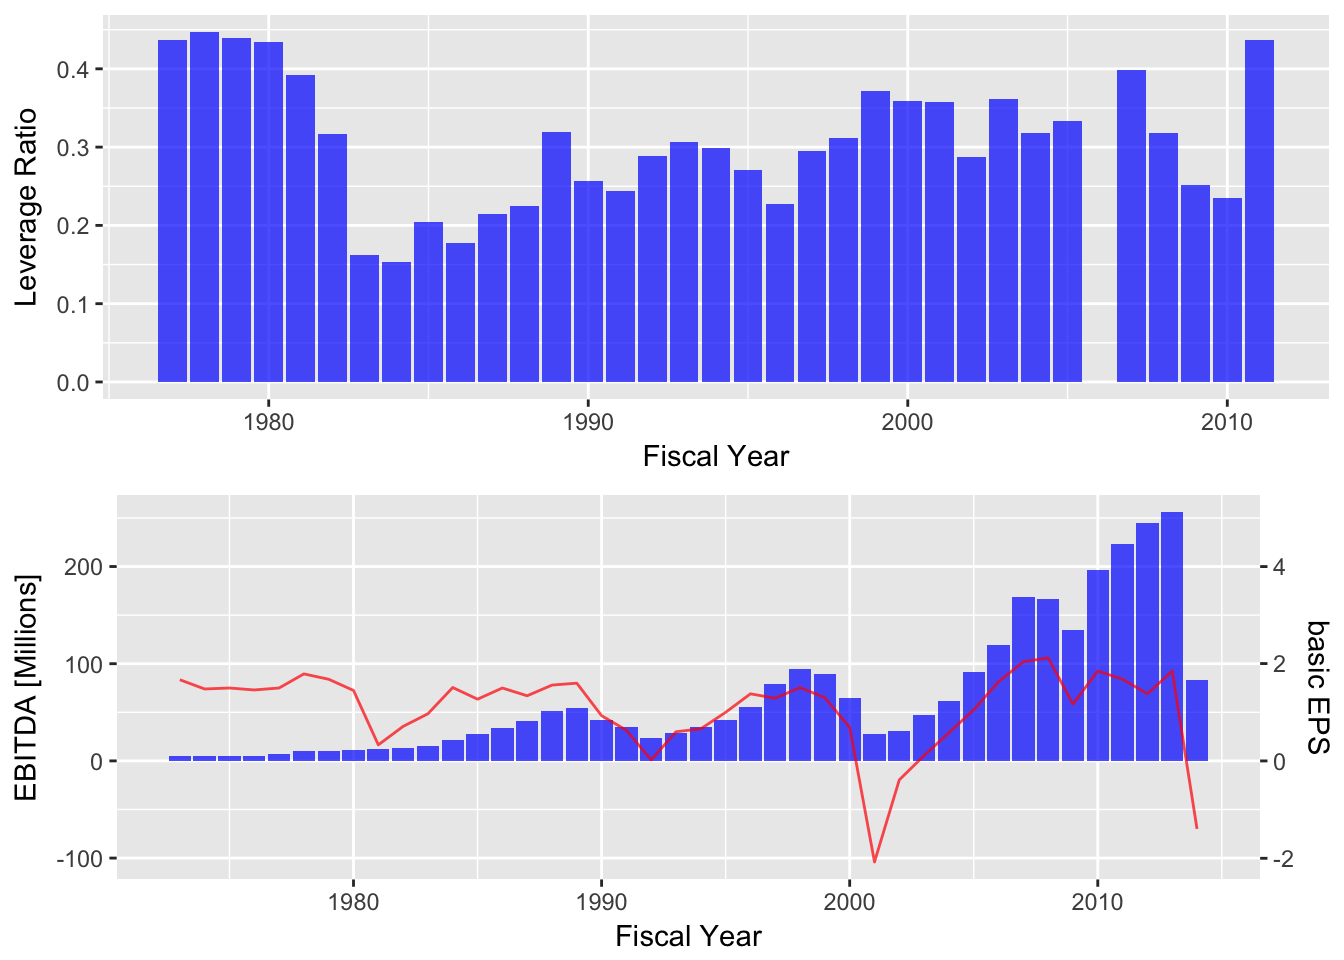
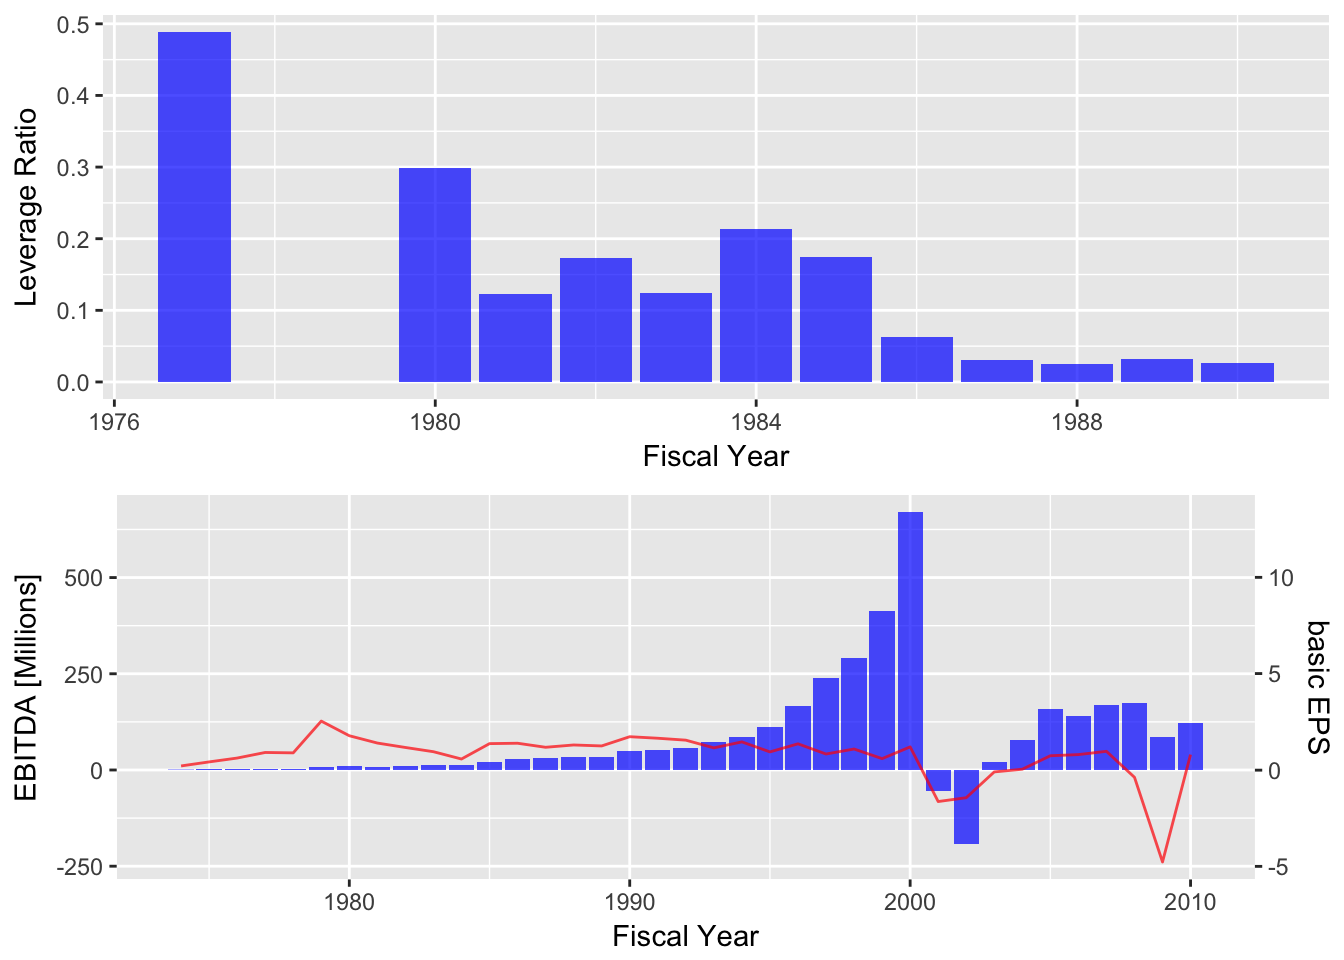
For illustration purpose, we draw two stocks out from the stock universe that has more than 20-year history. We choose cash flows of financial activity, investment activity and operation activity to better represent the operating status of the company. Also, both EBITA and Basic EPS Excluding Extraordinary Items are used as representatitves for earnings.
And the showcase of the annual data can be seen in the figures below. The Rdata for all stocks is stored online and you can access it from HERE.
Figures
-
Fundamental Information of Selected Stock 1

-
Fundamental Information of Selected Stock 1

-
Fundamental Information of Selected Stock 2

-
Fundamental Information of Selected Stock 2

R Code
Load the dependencies
1 | |
Load raw data
1 | |
Process the data
groupby the CUSIP and financial year, and calculate the ratios correspongding to that year.
1 | |