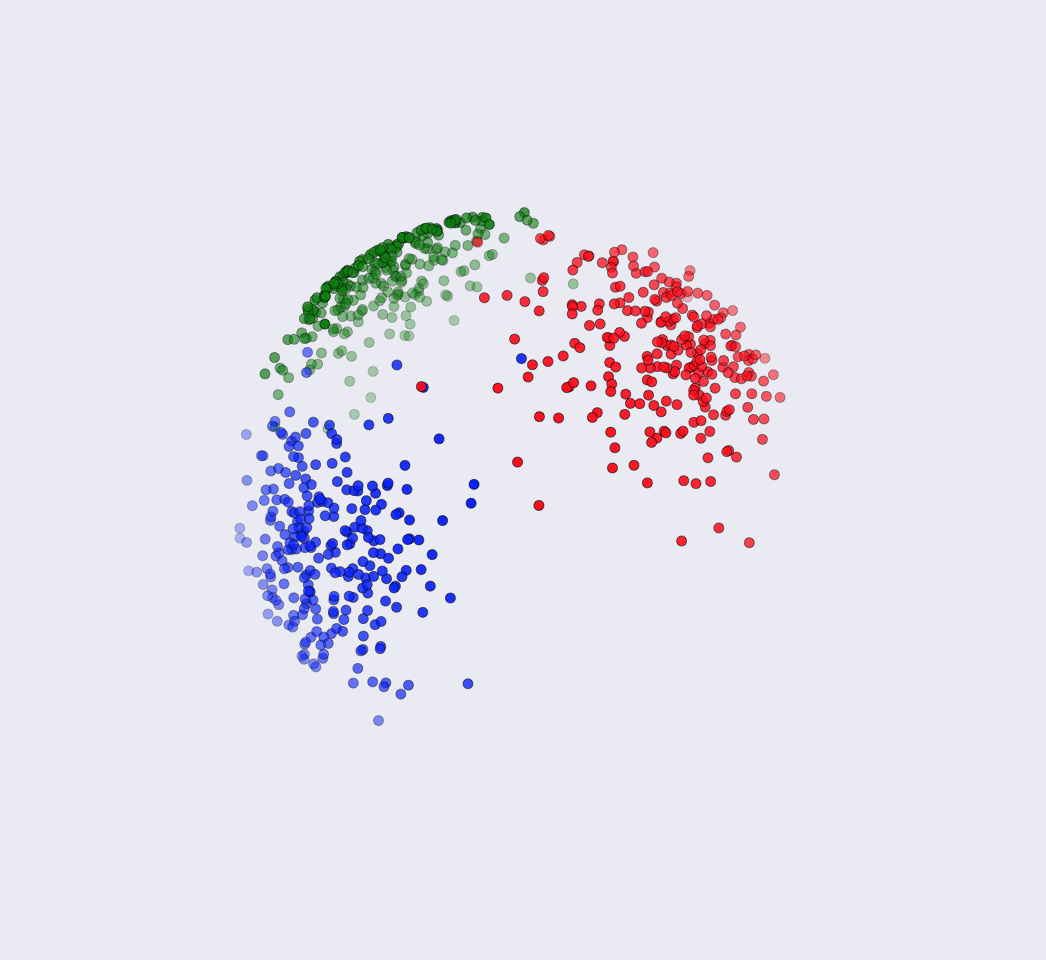
The main goal for this project is to build a quantitative finance research document curation engine that could perform well even when a small number of training samples are supplied.
Von Mises-Fisher Distribution
Theory
In directional statistics, the von Mises–Fisher distribution (named after Ronald Fisher and Richard von Mises), is a probability distribution on the \((p-1)\)-dimensional sphere in \(\mathbb{R}^p\). If \(p=2\) the distribution reduces to the von Mises distribution on the circle.
The probability density function of the von Mises–Fisher distribution for the random p-dimensional unit vector \{\mathbf {x}\), is given by:
\[f_p (\mathbf{x}; \boldsymbol{\mu}, \kappa) = C_p (\kappa) exp(\kappa \boldsymbol{\mu}^T \mathbf{x})\]where \(\kappa \geq 0,\left\Vert {\boldsymbol{\mu}}\right\Vert =1\), and the normalization constant \(C_{p}(\kappa )\), is equal to
\[C_{p}(\kappa)={\frac{\kappa^{p/2-1}}{(2\pi )^{p/2}I_{p/2-1}(\kappa )}}\]where \(I_{v}\) denotes the modified Bessel function of the first kind at order \(v\). If \(p=3\), the normalization constant reduces to
\[C_{3}(\kappa )={\frac{\kappa}{4\pi\sinh\kappa}}={\frac{\kappa}{2\pi(e^{\kappa }-e^{-\kappa})}}\]The parameters \(\mu\), and \(\kappa\), are called the mean direction and concentration parameter, respectively. The greater the value of \(\kappa\), the higher the concentration of the distribution around the mean direction \(\mu\). The distribution is unimodal for \(\kappa>0\), and is uniform on the sphere for \)\kappa=0\).
The von Mises–Fisher distribution for \(p=3\), also called the Fisher distribution, was first used to model the interaction of electric dipoles in an electric field. Other applications are found in geology, bioinformatics, and text mining.
Estimation of Parameters
A series of N independent measurements \(x_{i}\) are drawn from a von Mises–Fisher distribution. Define
\[A_{p}(\kappa)=\frac {I_{p/2}(\kappa)} {I_{p/2-1}(\kappa)}\]Then the maximum likelihood estimates of \(\mu\), and \(\kappa\), are given by
\[\begin{aligned} \mu &= \frac{\sum_i^N x_i}{\|\sum_i^N x_i\|},\\ \kappa &= A_p^{-1}(\bar{R}) \end{aligned}\]Thus \(\kappa\) is the solution to
\[A_p(\kappa) = \frac{\|\sum_i^N x_i\|}{N} = \bar{R}\]A simple approximation to \(\kappa\) is
\[\hat{\kappa} = \frac{\bar{R}(p-\bar{R}^2)}{1-\bar{R}^2}\]but a more accurate measure can be obtained by iterating the Newton method a few times
\[\begin{aligned} \hat{\kappa}_1 &= \hat{\kappa} - \frac{A_p(\hat{\kappa})-\bar{R}}{1-A_p(\hat{\kappa})^2-\frac{p-1}{\hat{\kappa}}A_p(\hat{\kappa})} ,\\ \hat{\kappa}_2 &= \hat{\kappa}_1 - \frac{A_p(\hat{\kappa}_1)-\bar{R}}{1-A_p(\hat{\kappa}_1)^2-\frac{p-1}{\hat{\kappa}_1}A_p(\hat{\kappa}_1)} \end{aligned}\]For \(N \geq 25\), the estimated spherical standard error of the sample mean direction can be computed as
\[\hat{\sigma} = \left(\frac{d}{N\bar{R}^2}\right)^{1/2}\]where
\[d = 1 - \frac{1}{N}\sum_i^N (\mu^Tx_i)^2\]It’s then possible to approximate a \(100(1-\alpha)\% \) confidence cone about \(\mu\) with semi-vertical angle
\[q = \arcsin(e_\alpha^{1/2}\hat{\sigma})\]where \(e_\alpha = -\ln(\alpha)\).
Reasoning behind its Usage on Document Classification
Theoritical and Empirical Proof
To clustering objects in text documents and gene expressions analysis, the representation as vectors are high-dimensional and directional. The commonly used mixture of multivariate Gaussians tends to perform poorly because of Euclidian distortion. Instead, cosine similarity is more effective in measuring the similarity for analyzing and clustering text documents. This is because the normalization of data vectors helps to remove the biases induced by document length. Furthermore, spherical kmeans algorithm has been found to work well for text clustering. And the directional data can be well processed.
Pearson Correlation
Given \(x, y \in \mathbb{R}^d\), the Pearson product moment correlation between them is given by \(\rho(x, y) = \frac{\sum_{i=1}^{d}{(x_i - \bar{x})(y_i - \bar{y})}}{\sqrt{\sum_{i=1}^{d}{(x_i -\bar{x})^2}}\sqrt{\sum_{i=1}^{d}{(y_i -\bar{y})^2}}}\), where \(\bar{x}=\frac1d \sum_{i=1}^d{x_i}, \bar{y}=\frac1d \sum_{i=1}^d{y_i}\).
Consider the mapping \(\mathbf{x} \mapsto \tilde{\mathbf{x}}\) such that \(\tilde{\mathbf{x}} = \frac{x_i - \tilde{x}}{\sqrt{\sum_{i=1}^d{(x_i - \bar{x})^2}}}\), and a similar mapping for \(\mathbf{y}\). Then we have
\[\rho(x, y) = \tilde{\mathbf{x}}^T \tilde{\mathbf{y}}\]Moreover, \(\lvert\lvert \tilde{\mathbf{x}}\rvert\rvert_2 = \lvert\lvert \tilde{\mathbf{y}}\rvert\rvert_2 = 1\). Thus, the Pearson correlation is exactly the cosine similarity between \(\tilde{\mathbf{x}}\) and \(\tilde{\mathbf{y}}\). Hence, analysis and clustering of data using Pearson correaltions is essentially a clustering problem for directional data.
Clustering on the unit hypersphere in scikit-learn

Algorithms
The package spherecluster implements the three algorithms outlined in “Clustering on the Unit Hypersphere using von Mises-Fisher Distributions”, Banerjee et al., JMLR 2005, for scikit-learn.
-
Spherical K-means (spkmeans)
Spherical K-means differs from conventional K-means in that it projects the estimated cluster centroids onto the the unit sphere at the end of each maximization step (i.e., normalizes the centroids).
-
Mixture of von Mises Fisher distributions (movMF)
Much like the Gaussian distribution is parameterized by mean and variance, the von Mises Fisher distribution has a mean direction \(\mu\) and a concentration parameter \(\kappa\). Each point \(x_i\) drawn from the vMF distribution lives on the surface of the unit hypersphere \(\S^{N-1}\) (i.e., \(|x_i|_2 = 1\)) as does the mean direction \(|\mu|_2 = 1\). Larger \(\kappa\) leads to a more concentrated cluster of points.
If we model our data as a mixture of von Mises Fisher distributions, we have an additional weight parameter \(\alpha\) for each distribution in the mixture. The movMF algorithms estimate the mixture parameters via expectation-maximization (EM) enabling us to cluster data accordingly.
-
soft-movMF
Estimates the real-valued posterior on each example for each class. This enables a soft clustering in the sense that we have a probability of cluster membership for each data point.
-
hard-movMF
Sets the posterior on each example to be 1 for a single class and 0 for all others by selecting the location of the max value in the estimator soft posterior.
Beyond estimating cluster centroids, these algorithms also jointly estimate the weights of each cluster and the concentration parameters. We provide an option to pass in (and override) weight estimates if they are known in advance.
Label assigment is achieved by computing the argmax of the posterior for each example.
-
Relationship between spkmeans and movMF
Spherical k-means is a special case of both movMF algorithms.
-
If for each cluster we enforce all of the weights to be equal \(\alpha_i = 1/n_clusters\) and all concentrations to be equal and infinite \(\kappa_i \rightarrow \infty\), then soft-movMF behaves as spkmeans.
-
Similarly, if for each cluster we enforce all of the weights to be equal and all concentrations to be equal (with any value), then hard-movMF behaves as spkmeans.